About Omix
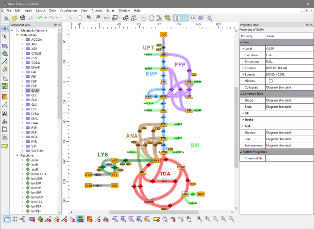
Omix® is a user-friendly and highly customizable editor and modeling tool for metabolic network diagrams, equipped with extensive data visualization features. Main application fields are the interactive mapping of multi-omics data in the direct context of network drawings, in particular in the fields of transcriptomics, metabolomics and fluxomics.
Omix' unique features include (but are not limited to):
- Drawing high-quality network diagrams with extensive annotation potential.
- Interactive visualization of data from experiment as well as simulation in metabolic networks.
- Different levels of detail to decrease complexity and flexibly highlight different aspects of the network structure.
- Support of the drawing process by semi-automatic drawing features.
- Extensible by plug-ins.
- Visual analysis of time-dependent data by animations.
- Visualization of chemical structures.
- Kinetic modeling.
- Modeling and visualization of a metabolic network's atomic layer.
- Modeling of 13C isotope labeling experiments as input for 13CFLUX2.
- 3D visualization of omics-data and network topologies.
- Stoichiometric analysis: elementary flux modes, network dependencies, flux balances...
Particularly for newcomers a simple and fast access to Omix is warranted. Omix realizes ease of use by addressing the user's experience with standard graphics and office software. On the other hand highest flexibility in designing networks and visualization is provided.
Visit the example features for more information about the capabilities of Omix.
Network Assembly
Omix supports scientists in assembling metabolic network models from various sources. Multiple plug-ins are available that allow importing network stoichiometries and/or parameters from publications, databases and different file formats. The big advantage: Omix combines a drawing editor with a modeling programm and a visualization tool. By this, network documents can be used and re-used in multiple steps of the knowledge acquisition pipeline.
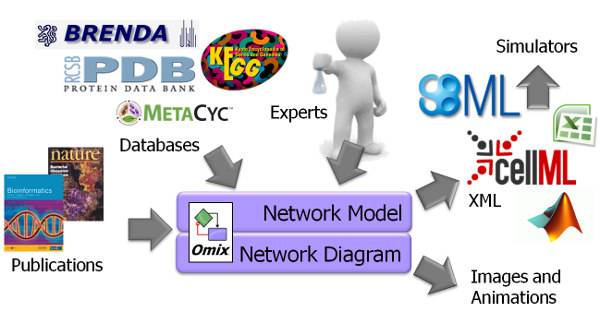
Through its inherent visual model representation, Omix is useful in any initial model draft phase. Later, it can be used to prepare comprehensive models of metabolic processes including stoichiometric modeling, kinetic modeling and model parametrization. Visualization assisted modeling with Omix is much more safe and less error-prone than textual model editing. When metabolic network modeling takes place in Omix, the visual representation of the model is immediately available for scientific discussion, presentation and publication. The network models as well as diagrams can be exported in a large number of different model and image file formats.
Omix has extensive import and export capabilities, e.g.:
- Import and export of SBML, SBGM-ML and FluxML models.
- Import of networks in BioPAX and GraphML.
- Export of stoichiometries to MATLAB®.
- Import of network models from spreadsheet files as well as from reaction equations.
- Import of network models from KEGG Kyoto Encyclopedia of Genes and Genomes® database.
- Import of network models from the BioCyc Database Collection.
- Import of data from Excel®, HDF5 and other formats.
- Diagram export into bitmap and vector graphic formats like PNG, JPG and SVG as well as animations (SWF Flash) and movie files (AVI).
Read more details about plug-ins for Omix.
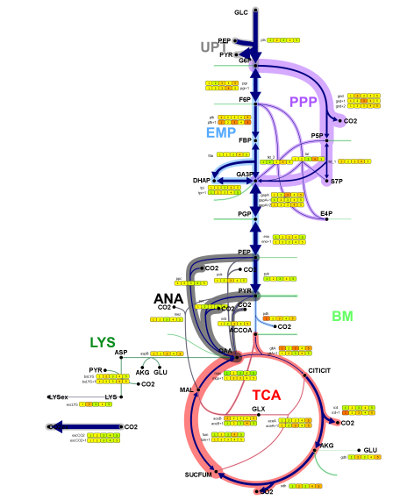
Multi-Omics Data Visualization
One of the major domains of Omix is the visualization of data from experiment and simulation. Instead of displaying all state variables of the biological system in independent bar plots and/or function graph, visualization in Omix takes place inside of the network diagram. Datasets can directly be in inspected in combination with the mindmap of the biological system. This leads to a fast overview and helps to get an integrated view of data of different type.
As an outstanding feature, the way data is visualized can completely be defined by the user. The Quick Visualizer is a dialog-based visualization manager that allows to easily design sophisticated data visualization methods. For instance, Quick Visualizer enables the user to define the dynamic modification of the visual properties of diagram elements according to multi-omics data. Especially, time-dependent numerical datasets from experiment and simulation are easily visualized and animated in the context of metabolic network. Beside this, Omix diagrams are programmable. The scripting language OVL (Omix Visualization Language™) gives fast access to visual properties of nodes and edges composing the network.
With Omix, visualization in the context of metabolic networks becomes highly adaptable to individual requirements and preferences. The efficient and scalable visual exploration of multi-omics data enables scientists to discover novel insights and to generate hypotheses on hidden biological mechanisms. This makes Omix a valuable software tool for each corporate research department and scientific institute in systems biology. Visit the visualization examples to get a deeper impression of the wide range of possibilities in visualizing data with Omix.
Users' Opinions
In my view, the strengths of Omix are in the ease of drawing nice looking diagrams quickly, intuitive organization of object classes (reactions, metabolites, pathways, cofactors, etc.), and easy integration of large-scale datasets.
It is exactly the tool for generating a high-quality visualization of a complex metabolic network that I have been looking for. I am generally very impressed with the software and I especially like the customizability through the OVL interface.
Omix allows us to draw biochemical networks in a fast and efficient manner through the many built-in features. Representation of omics data in Omix is straight forward through the use of the easily understandable and intuitive OVL scripting language, even for experimentalists with little programming skills like us. Altogether, we can now draw biochemical networks fast, represent them just like we want to, show all our data and save time. Omix has been a great improvement for our center to say the least.
Also refer to the list of reference publications, containing visualizations made with Omix.
Site Overview
Imprint |
Terms Of Use |
Privacy Policy
Copyright © 2024 Omix Visualization GmbH & Co. KG. All rights reserved.
Omix® is a registered trademark of Omix Visualization GmbH & Co. KG.