Visualization Examples
Visualization of Fluxome Data
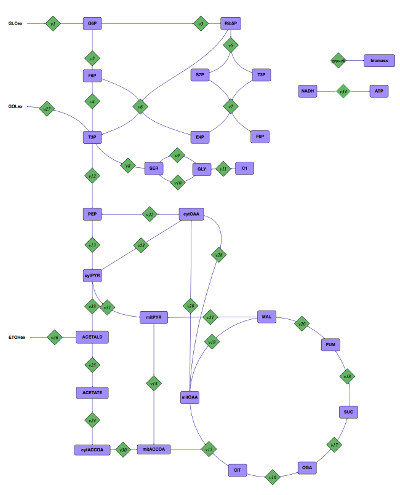
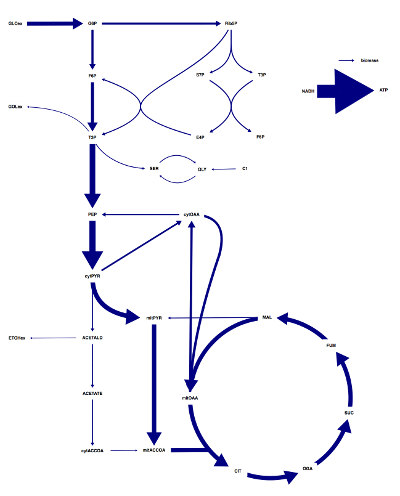
The example image on the right shows the flux distribution of the B. subtilis central carbon metabolism taken from Ebert 2012. In comparison with the default view when the network is drawn (left side) the value of the level of detail approach in Omix comes clear. Depending on the situation, it is necessary to display metabolic pathways in different abstractions. Since Omix allows to hide entire classes of diagram components, different levels of detail are immediately possible without effort.
Site Overview
Visualization Examples
Imprint |
Terms Of Use |
Privacy Policy
Copyright © 2024 Omix Visualization GmbH & Co. KG. All rights reserved.
Omix® is a registered trademark of Omix Visualization GmbH & Co. KG.