Visualization Examples
Metabolome Visualization with Accessories
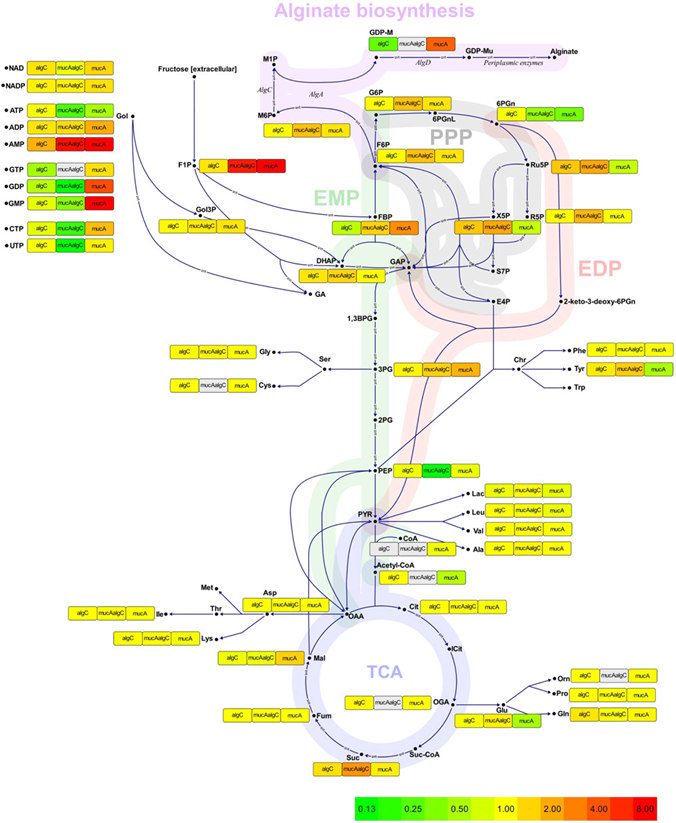
The image shows metabolome data from three mutants (ΔalgC, mucA- ΔalgC and mucA) relative to their wild type (Pseudomonas fluorescens SBW25). The ratios are displayed on special boxes, the so-called accessories. OVL allows to equip network components with any number of additional boxes, text fields, images and many more, as additional information carriers for the visualization. The underlying metabolic network only shows the labels of the metabolite symbols and their stoichiometric connections. This lets the observer concentrate on the information displayed by the accessory boxes. The example is taken from Lien et al. 2012.
Site Overview
Visualization Examples
Imprint |
Terms Of Use |
Privacy Policy
Copyright © 2024 Omix Visualization GmbH & Co. KG. All rights reserved.
Omix® is a registered trademark of Omix Visualization GmbH & Co. KG.