Example Features
Script-Based Data Visualization
Customizability is very important, because biotechnological research rapidly develops new visualization demands. The novel approach of Omix is to make network diagrams programmable in order to allow custom ways of mapping data to the appearance of the network components. Programming a network takes place in a particular scripting language that was developed for Omix called Omix Visualization Language™ (OVL). You can easily write small scripts in OVL that manage the visualization of omics-data in network diagrams.
OVL offers many degrees of freedom to visualize data on biochemical networks by giving access to the visual properties of network components. Omix comes up with an extensive library for data visualization containing methods for loading data from various sources and types, searching in datasets and scaling of data.
In OVL visualization of omics-data can be realized in various ways. For the mapping of data to the appearance of network components OVL allows to change all visual properties of nodes and edges in the network diagram. For the visualization of data by annotating network components, OVL allows to define additional information carriers in the diagram. Here, the capabilities reach from simple text annotations to comprehensive graphics items. Furthermore, interactive components can be defined in a simplified manner. In this way, for instance, interaction with single network components or the animation of time-dependent datasets can be realized. Additionally, with OVL, you can extend network components with further custom properties and, by this, augment a network with arbitrary information.
View our visualization examples to get a deeper impression of the universal applicability of Omix for multi-omics data visualization.
Code Example
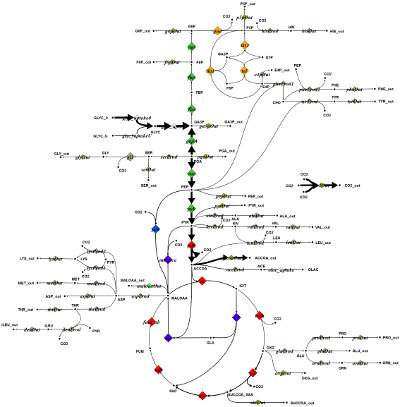
In the following code example, a button is defined that invokes a method when pressed by the user. Inside of the method the color fill level of all metabolite symbols in the network is changed to a random value as seen in the figure bottom. The impact of this simple code example is that a button occurs on the toolbar. When this button is pressed, the described changes in the diagram are performed.
extend MetabolicNetwork {

    PushButton change : changeLevels();

    void changeLevels() {
        for(Metabolite m : metabolites()){
            m.fillLevel = Math.random();
        }
    }
}
|
|
In this example, the assignment of a random value is chosen for the sake of brevity. Of course, methods in OVL can implement data computation as well as file and database in- and output as source for omics data.
Site Overview
Example Features
Imprint |
Terms Of Use |
Privacy Policy
Copyright © 2024 Omix Visualization GmbH & Co. KG. All rights reserved.
Omix® is a registered trademark of Omix Visualization GmbH & Co. KG.