Visualization Examples
Visualization of Transcriptome Data
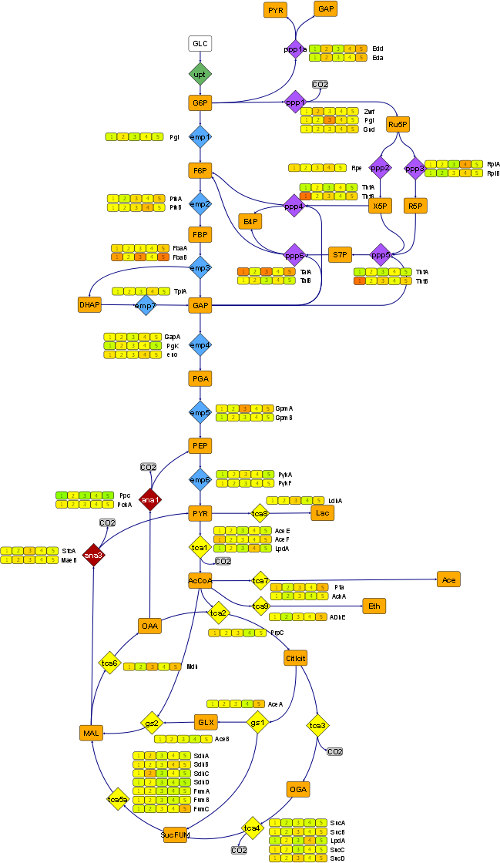
The picture shows the metabolic network of Escherichia coli. Each reaction is equipped with a number of small rectangle rows representing the enzymes participating in a reaction. Each column in the rows represents a certain experimental dataset. The user can switch between 43 different datasets visualized in the network. Each time, 5 datasets are shown simultaneously.
For more details about the example refer Droste 2011.
Site Overview
Visualization Examples
Imprint |
Terms Of Use |
Privacy Policy
Copyright © 2024 Omix Visualization GmbH & Co. KG. All rights reserved.
Omix® is a registered trademark of Omix Visualization GmbH & Co. KG.